IND/05 · CORPORATE ENERGY EXPOSURE
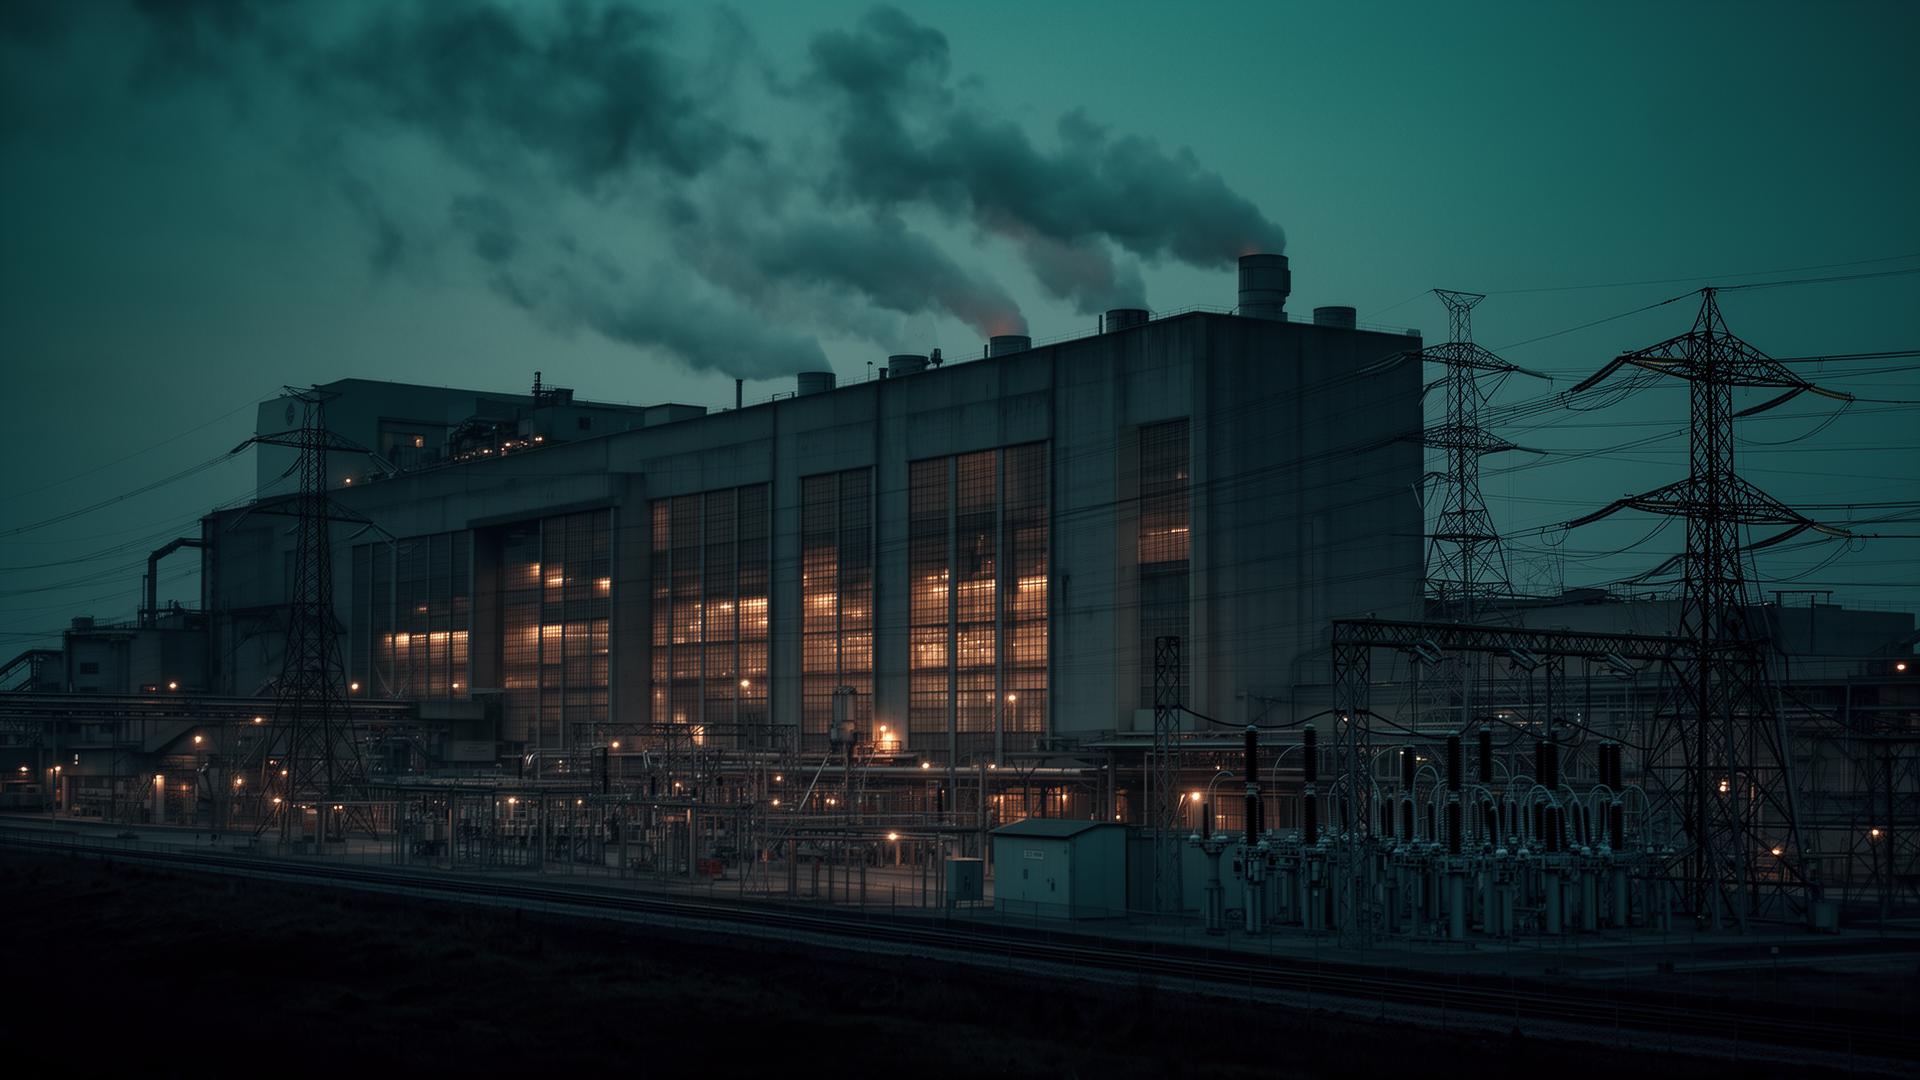
Corporate Energy Users
The bill is a symptom. The infrastructure is the exposure.
For manufacturers and large-load operators, we map where the footprint is structurally advantaged — and where power, tariff and grid risk compound for decades.
Utility cost
$22M / yr
Peak demand
38.4 MW
Load profile
LF 62%
Tariff
LGS-T · rider risk
Capacity
Firm 42 MW
Congestion
$6.2/MWh
Energy exposure
High
Expansion load
+14 MW
Service headroom
3.6 MW
Horizon
25 yr
Modeled · illustrative composite · S&M synthesis of public ISO/RTO, EIA and utility filings · As of Oct 2026
05
Facility energy intelligence
Sector-specific load, tariff and expansion exposure.
Facility energy intelligence · Manufacturing
Peak demand (MW)
41
Load factor (%)
62
Tariff exposure
58
Expansion load index
71
24-hour load profile · shaded = coincident-peak window
Representative sector profiles · modeled · not client data
03
Long-term energy economics
This month's bill versus the next 25 years.
25-yr cumulative · $896M
The monthly bill shows today. Infrastructure economics show the next 25 years — capacity charges, transmission riders, rate cases and expansion load compound.
Illustrative facility · modeled escalation · not a forecast for any specific site
04
Critical pressure vectors
Nine exposures on the corporate balance sheet.
Energy Cost Exposure
84All-in delivered cost and its drivers.
Tariff Intelligence
78Rate class, riders and upcoming rate cases.
Load Growth
66Process electrification and production expansion.
Facility Expansion
72Whether existing service can absorb the next line.
Power Availability
81Headroom at the serving substation.
Grid Risk
63Outage history, congestion and weather exposure.
Capital Planning
70Sequencing CAPEX against power constraints.
On-Site Energy Strategy
58Where behind-the-meter options actually pencil — technology-neutral.
Long-Term Energy Economics
8810–25 year cost and availability outlook.
06
Footprint intelligence
Each facility is connected to utilities, markets and risk.
Stock & Milster Intelligence Graph
07
Decision framework
Before expanding, relocating or contracting power.
- G1
Can the serving substation absorb expansion load?
PASSProceed with expansion plan.
FLAGModel upgrade cost and timing.
- G2
Is the tariff stable through the capital plan?
PASSHold cost assumptions.
FLAGStress rate-case scenarios.
- G3
Does on-site generation reduce risk or add it?
PASSScope options independently.
FLAGStay grid-served; optimize contract.
- G4
Is another site in the footprint structurally better?
PASSRe-allocate production.
FLAGInvest in place.
08
How Stock & Milster helps
Corporate infrastructure intelligence, independent of vendors.
Decision-grade deliverables
- D01Facility energy risk assessment
- D02Utility & tariff exposure review
- D03Corporate footprint posture map
- D0425-year energy-cost exposure model
- D05Capital-plan-aligned power strategy
Questions leadership brings to us
- Where is our footprint structurally advantaged?
- Which sites are exposed to the next rate-case cycle?
- How should capital sequence against power constraints?
Stock & Milster advises on the decision. We do not sell the project. Engagements are scoped to geography, facilities and depth of analysis.
10 · EXECUTIVE ACCESS